
We would like to do something different in this post. Usually, we focus more on programming and Java. However, in this post, we will have some fun by discussing how to calculate the Relative Strength Index (RSI) in a step by step guide.
And because this is Nullbeans.com, we will also provide you with an implementation in the Java programming language. Therefore, after this tutorial, you will be able to add the RSI indicator to your own custom made charts and statistics application 🙂
Introduction
The RSI is one of the most used and most popular technical indicators used in stock and commodities trading. You might be wondering if it makes sense to learn how a technical indicator is calculated.
From personal experience I found out that I could understand the technical indicator much better when I know how to calculate it. This is because you understand what the value of the indicator mathematically represents. And when you understand an indicator it means that you can use it in a better way while trading.
How to calculate the RSI
Unfortunately calculating the RSI is not as straightforward as calculating a moving average. This is because the RSI has multiple components to be calculated first before we can reach the final value of the RSI.
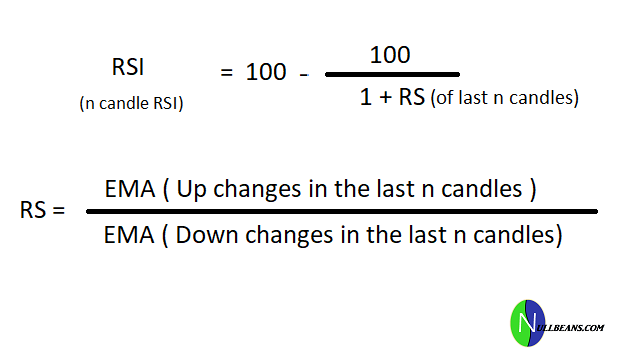
The good news is that these components are simple to calculate individually. So let us start by displaying the general formula for calculating the RSI and then we will we will break down this formula into components and calculate each of the components.
Calculating Up/Down changes
The first step we need to take is to decide which time frame and length do we use when calculating the RSI. This usually depends on each individual trader. However, a daily timeframe (day candle sticks) is a popular time frame so we will go with that for our example.
The second thing to decide is the length of the RSI (designated in the formula as n). The length will decide how far back in the past do look in order to calculate the RSI value of the current candle. For example, if we use a 14 day RSI, then it means that today’s RSI value is based on the changes that occurred in the last 14 days.
Now that we have decided the length and time frame, we will need to calculate the up changes and downward changes that occurred in the last 14 days. For this, we will use the following formulas.
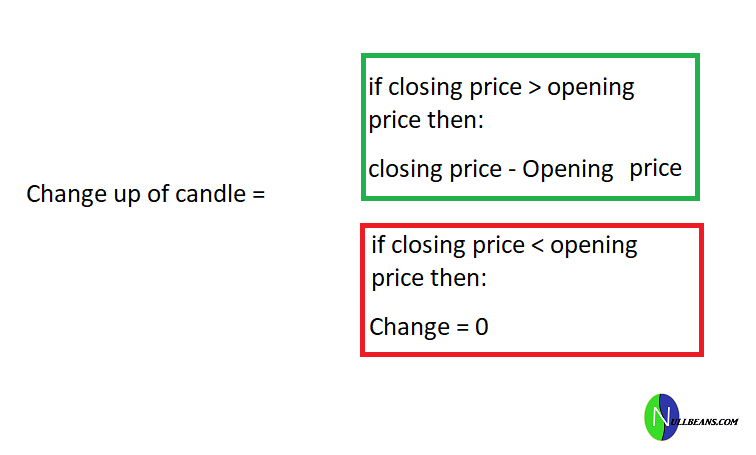
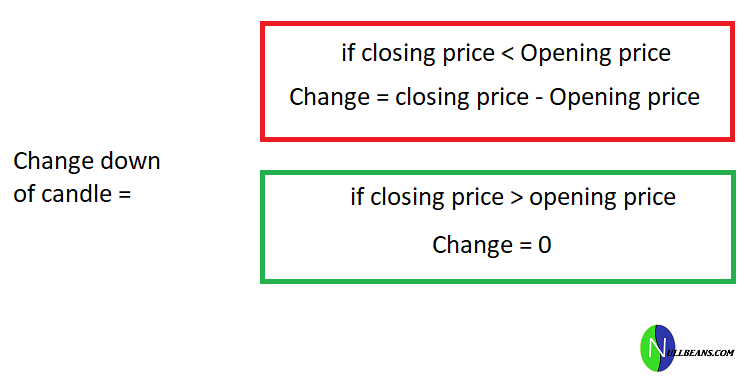
The aim of this calculation is to find out how much upward or downward force happened on each day. For example, if your favorite stock opened with the price of $10 and closed with the price of $8, then for this day:
- Change up = 0
- Change down = 2
On the other hand, if the opening price was $10 and the closing price was $13, then:
- Change up = 3
- Change down = 0
Example data set:
| Candle (i) | Opening price | Closing price | Change Up | Change Down |
| 1 | 13 | 12 | 0 | 1 |
| 2 | 12 | 15 | 3 | 0 |
| 3 | 15 | 17 | 2 | 0 |
| 4 | 17 | 16 | 0 | 1 |
When calculating the RSI of a given candle, we will need to calculate the change up and change down values for each of the last n candles. This will be important for our next step.
Calculating the SMMA of Up/Down changes
Now that we have calculated the change up and down values of the last n candles, we will need to calculate the simple or modified moving average (SMMA) of the up changes and down changes. The average is called the simple or modified because it first starts by using the simple moving average and then moves on to a “modified” moving average formula. A lot of internet articles use the simple moving average or the exponential one. However, this is not part of the original RSI formula. Here, we will show you here how to calculate the RSI as it shows on TradingView and other popular charting tools.
Just like the RSI, the SMMA also has a length and time frame. However, these remain the same as the ones chosen for the RSI. So for an n length RSI, we will need to calculate the n length SMMA of the changes.
The SMMA of day i in the chart is based on the SMMA of day i-1. And the SMMA of day i-1 depends on the SMMA of day i-2, and so on. In other words, it is a recursive calculate. However, you might ask, how do we calculate the SMMA of the first day/candle? Well, for the first candle, we will use the simple moving average value (SMA) will serve as the SMMA. The formula of the RSI is as follows.

It is important to note that if you are starting your calculations from the start of your dataset is that you will not be able to calculate the RSI or SMMA for the first n values. This is because that you will need these values to calculate the simple average of the nth value. Let us go back to our data set and calculate the 14 day SMA.
| Candle (i) | Change Up | Change Down | ||||
| 1 | 0 | 1 | ||||
| 2 | 3 | 0 | ||||
| 3 | 2 | 0 | ||||
| 4 | 0 | 1 | ||||
| 5 | 0 | 2 | ||||
| 6 | 0 | 2 | ||||
| 7 | 1 | 0 | ||||
| 8 | 0 | 2 | ||||
| 9 | 2 | 0 | ||||
| 10 | 2 | 0 | ||||
| 11 | 4 | 0 | ||||
| 12 | 2 | 0 | ||||
| 13 | 1 | 0 | SMA (Up changes) | SMA (Down Changes) | SMMA (Up changes) | SMMA (Down changes) |
| 14 | 1 | 0 | 1.285714286 | 0.5714285714 | 1.285714286 | 0.5714285714 |
| 15 | 1 | 0 | N/A | N/A | 1.265306122 | 0.5306122449 |
| 16 | 0 | 3 | N/A | N/A | 1.174927114 | 0.7069970845 |
| 17 | 1 | 0 | N/A | N/A | 1.16243232 | 0.6564972928 |
| 18 | 0 | 1 | N/A | N/A | 1.07940144 | 0.6810332005 |
| 19 | 2 | 0 | N/A | N/A | 1.14515848 | 0.6323879718 |
| 20 | 4 | 0 | N/A | N/A | 1.349075731 | 0.5872174024 |
| 21 | 2 | 0 | N/A | N/A | 1.395570322 | 0.5452733023 |
| 22 | 2 | 0 | N/A | N/A | 1.43874387 | 0.5063252092 |
| 23 | 1 | 0 | N/A | N/A | 1.407405022 | 0.4701591229 |
| 24 | 0 | 2 | N/A | N/A | 1.306876092 | 0.5794334712 |
| 25 | 3 | 0 | N/A | N/A | 1.427813514 | 0.5380453661 |
| 26 | 0 | 2 | N/A | N/A | 1.325826835 | 0.6424706971 |
| 27 | 0 | 2 | N/A | N/A | 1.231124918 | 0.7394370759 |
| 28 | 4 | 0 | N/A | N/A | 1.42890171 | 0.6866201419 |
Now that we have calculated the SMA of the up and down changes, we can use it as the first SMMA to calculate the subsequent SMMA values by using our formula.
Calculating the RS
The RSI indicator is based on the changes in the price action and not on the actual price itself . This is where the term Relative Strength (RS) comes from.
Calculating the RS is quite simple. We need to divide the SMMA of the up changes by the SMMA of the down changes.
Calculating the final RSI value
Now that we have all the components ready to calculate the final RSI value, we will simply have to follow our formula from the beginning of the post.
Notice that the larger the upward SMMA is, the larger the RS and RSI values are.
| SMMA (Up changes) | SMMA (Down changes) | RS | RSI |
| 1.285714286 | 0.5714285714 | 2.25 | 69.23076923 |
| 1.265306122 | 0.5306122449 | 2.384615385 | 70.45454545 |
| 1.174927114 | 0.7069970845 | 1.66185567 | 62.43222308 |
| 1.16243232 | 0.6564972928 | 1.770658208 | 63.90749327 |
| 1.07940144 | 0.6810332005 | 1.584946871 | 61.31448536 |
| 1.14515848 | 0.6323879718 | 1.810847978 | 64.42354734 |
| 1.349075731 | 0.5872174024 | 2.297404208 | 69.67311446 |
| 1.395570322 | 0.5452733023 | 2.559396024 | 71.90534593 |
| 1.43874387 | 0.5063252092 | 2.841541057 | 73.9687801 |
| 1.407405022 | 0.4701591229 | 2.993465306 | 74.95909133 |
| 1.306876092 | 0.5794334712 | 2.255437694 | 69.28216437 |
| 1.427813514 | 0.5380453661 | 2.653704695 | 72.63051934 |
| 1.325826835 | 0.6424706971 | 2.063637829 | 67.35906606 |
| 1.231124918 | 0.7394370759 | 1.664948862 | 62.4758278 |
| 1.42890171 | 0.6866201419 | 2.081065821 | 67.5436989 |
You can view the full data set in the Google sheets link here.
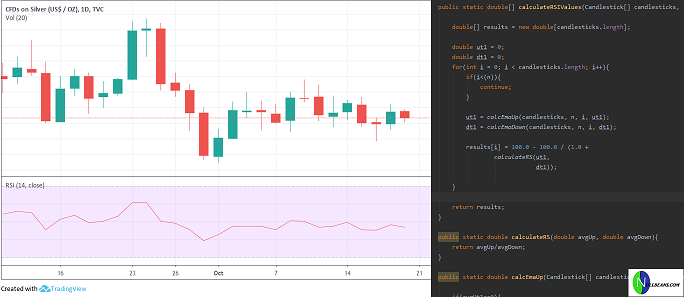
Calculating the RSI using Java
For all those who would like to build the next smart trading program, I have prepared the following code in Java to calculate the RSI.
The data used in this example is based on the Candlestick class. The class looks as follows:
public class Candlestick {
    private Long openTime;
    private double open;
    private double close;
}
Note that the getters and setters have been ommitted for display purposes. Now that we have our data in the form of Candlesticks, we can build the RSI calculator class. To calculate the SMMA of the up and down changes, we can use the following methods.
    public static double calcSmmaUp(Candlestick[] candlesticks, double n, int i, double avgUt1){

        if(avgUt1==0){
            double sumUpChanges = 0;

            for(int j = 0; j < n; j++){
                double change = candlesticks[i - j].getClose() - candlesticks[i - j].getOpen();

                if(change > 0){
                    sumUpChanges+= change;
                }
            }
            return sumUpChanges / n;
        }else {
            double change = candlesticks[i].getClose() - candlesticks[i].getOpen();
            if(change < 0){
               change = 0;
            }
            return ((avgUt1 * (n-1)) + change) / n ;
        }

    }

    public static double calcSmmaDown(Candlestick[] candlesticks, double n, int i, double avgDt1){
        if(avgDt1==0){
            double sumDownChanges = 0;

            for(int j = 0; j < n; j++){
                double change = candlesticks[i - j].getClose() - candlesticks[i - j].getOpen();

                if(change < 0){
                    sumDownChanges-= change;
                }
            }
            return sumDownChanges / n;
        }else {
            double change = candlesticks[i].getClose() - candlesticks[i].getOpen();
            if(change > 0){
                change = 0;
            }
            return ((avgDt1 * (n-1)) - change) / n ;
        }

    }
Please note that these calculations could be done in a much more efficient way. However, the code in this post is only for demonstration purposes. If you plan to build a production application, then you will need to use a data structure other than the double, such as BigDecimals . You will also need to have a more efficient algorithm.
Now that we have the SMMAs calculated, all we need to do is to calculate the RS and the RSI.
    public static double[] calculateRSIValues(Candlestick[] candlesticks, int n){

        double[] results = new double[candlesticks.length];

        double ut1 = 0;
        double dt1 = 0;
        for(int i = 0; i < candlesticks.length; i++){
            if(i<(n)){
                continue;
            }

            ut1 = calcSmmaUp(candlesticks, n, i, ut1);
            dt1 = calcSmmaDown(candlesticks, n, i, dt1);

            results[i] = 100.0 - 100.0 / (1.0 +
                    calculateRS(ut1,
                                dt1));

        }

        return results;
    }
Notice that we feed the SMMA calculation methods with a Zero value previous SMMA. This is to indicate that we will need to calculate the SMA as this is the first SMMA value.
Summary
In this post, we discussed step by step how to calculate the RSI and implement the calculation in Java.
If you like to see more of this kind of post, then please let us know in the comments section below.